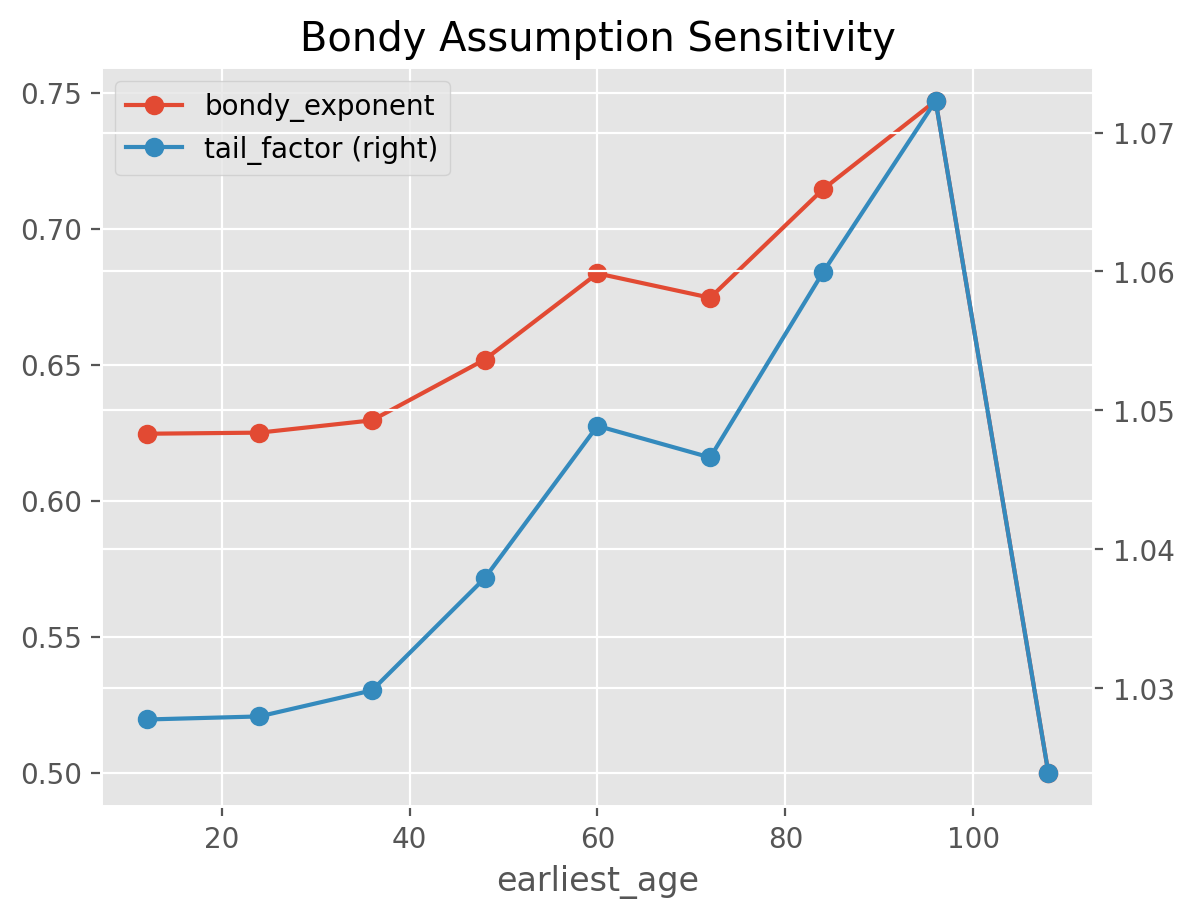
Bondy Tail Sensitivity#
import chainladder as cl
This example demonstrates the usage of the TailBondy estimator as well as
passing multiple scoring functions to GridSearch. When the earliest_age
is set to the last available in the Triangle, the estimator reverts to the
traditional Bondy method.
# Fit basic development to a triangle
tri = cl.load_sample("tail_sample")["paid"]
dev = cl.Development(average="simple").fit_transform(tri)

# Return both the tail factor and the Bondy exponent in the scoring function
scoring = {
    "tail_factor": lambda x: x.tail_.values[0, 0],
    "bondy_exponent": lambda x: x.b_.values[0, 0],
}

# Vary the 'earliest_age' assumption in GridSearch
param_grid = dict(earliest_age=list(range(12, 120, 12)))
grid = cl.GridSearch(cl.TailBondy(), param_grid, scoring)
results = grid.fit(dev).results_