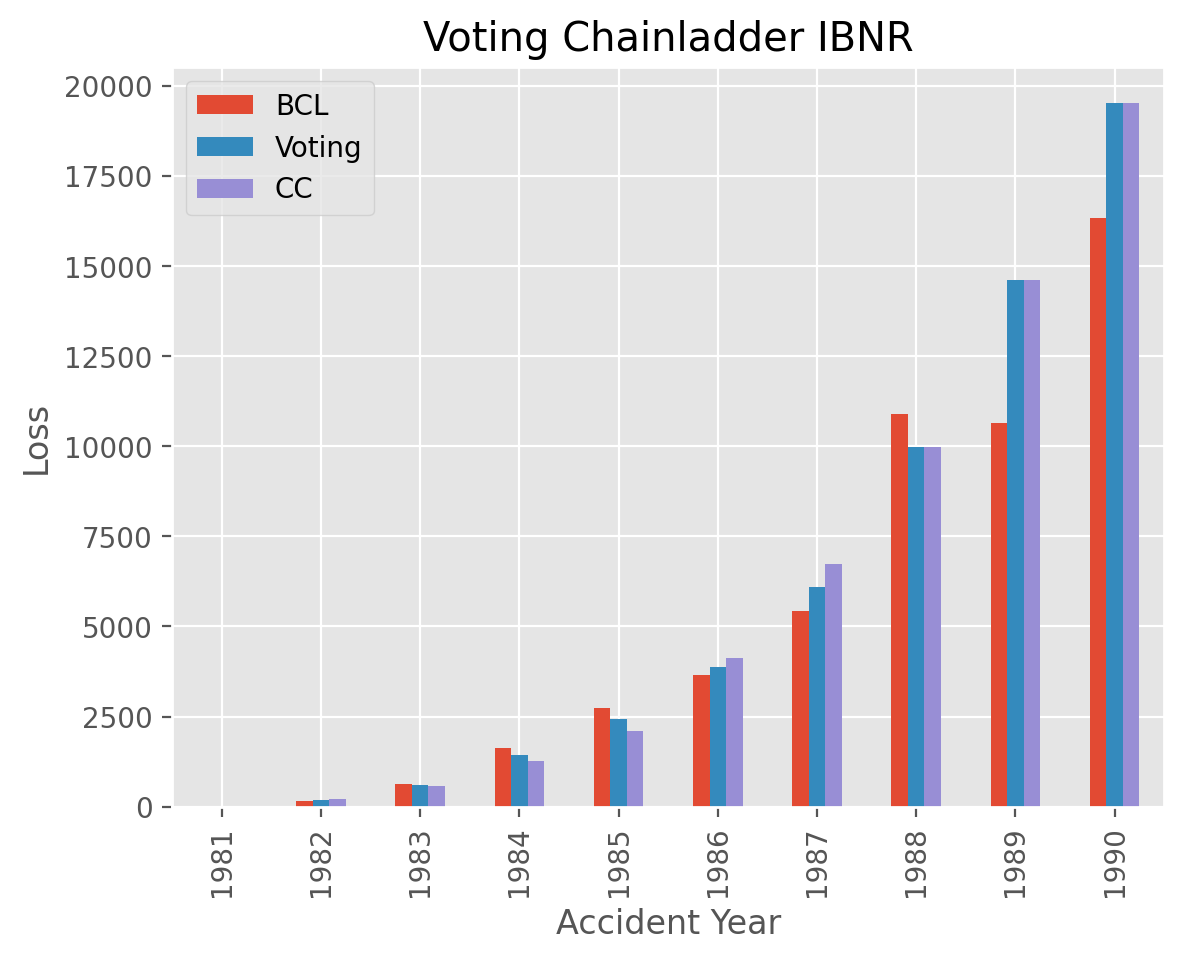
VotingChainladder Basics#
import chainladder as cl
import pandas as pd
This example demonstrates how you can can use the Voting Chainladder method.
# Load the data
raa = cl.load_sample("raa")
cl_ult = cl.Chainladder().fit(raa).ultimate_  # Chainladder Ultimate
apriori = cl_ult * 0 + (float(cl_ult.sum()) / 10)  # Mean Chainladder Ultimate

# Load estimators to vote between
bcl = cl.Chainladder()
cc = cl.CapeCod()
estimators = [("bcl", bcl), ("cc", cc)]

# Fit VotingChainladder using CC after 1987 and a blend of BCL and CC otherwise
vot = cl.VotingChainladder(
    estimators=estimators,
    weights=lambda origin: (0, 1) if origin.year > 1987 else (0.5, 0.5),
)
vot.fit(raa, sample_weight=apriori)

# Plotting
bcl_ibnr = bcl.fit(raa).ibnr_.to_frame(origin_as_datetime=False)
cc_ibnr = cc.fit(raa, sample_weight=apriori).ibnr_.to_frame(origin_as_datetime=False)
vot_ibnr = vot.ibnr_.to_frame(origin_as_datetime=False)

plot_ibnr = pd.concat([bcl_ibnr, vot_ibnr, cc_ibnr], axis=1)
plot_ibnr.columns = ["BCL", "Voting", "CC"]