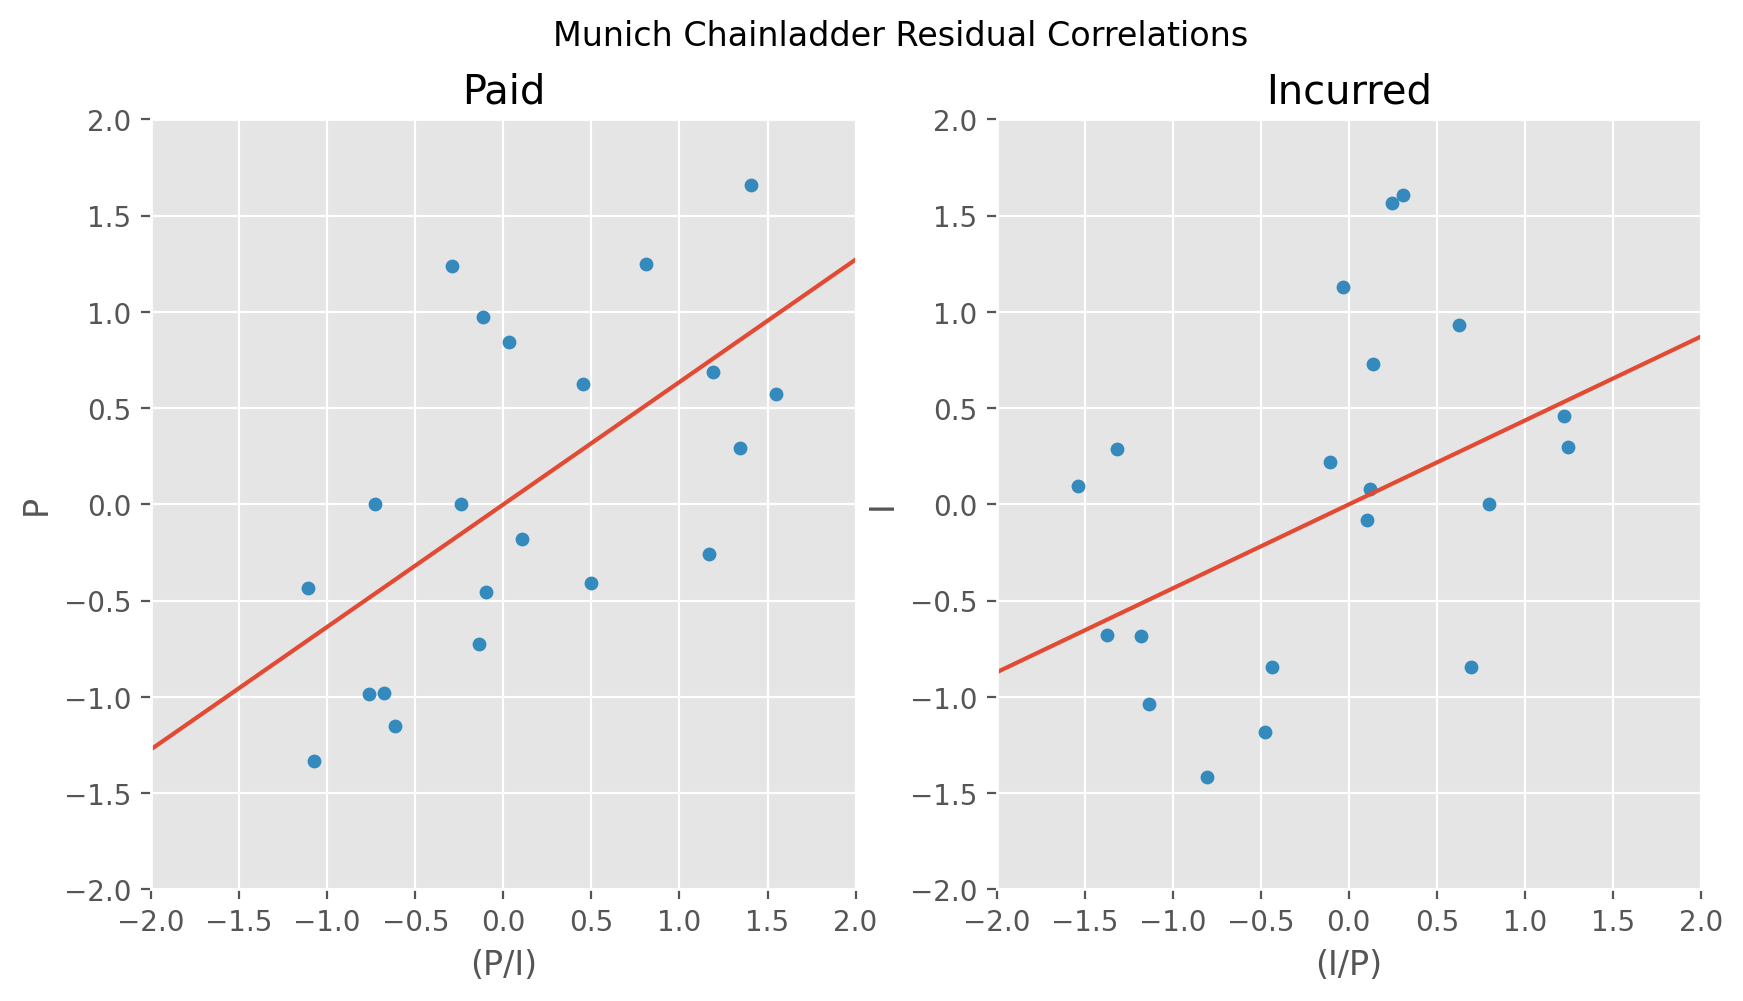
MunichAdjustment Correlation#
import chainladder as cl
import pandas as pd
import numpy as np
This example demonstrates how to recreate the the residual correlation plots of the Munich Chainladder paper.
# Fit Munich Model
mcl = cl.load_sample("mcl")
model = cl.MunichAdjustment([("paid", "incurred")]).fit(mcl)

# Paid lambda line
paid_lambda = pd.DataFrame({
    "(P/I)": np.linspace(-2, 2, 2),
    "P": np.linspace(-2, 2, 2) * model.lambda_.loc["paid"],
})

# Paid scatter
paid_plot = pd.concat(
    (
        model.resids_["paid"].melt(value_name="P")["P"],
        model.q_resids_["paid"].melt(value_name="(P/I)")["(P/I)"],
    ),
    axis=1,
)

# Incurred lambda line
inc_lambda = pd.DataFrame({
    "(I/P)": np.linspace(-2, 2, 2),
    "I": np.linspace(-2, 2, 2) * model.lambda_.loc["incurred"],
})

# Incurred scatter
incurred_plot = pd.concat(
    (
        model.resids_["incurred"].melt(value_name="I")["I"],
        model.q_resids_["incurred"].melt(value_name="(I/P)")["(I/P)"],
    ),
    axis=1,
)