MunichAdjustment Basics#
import chainladder as cl
import pandas as pd
This example demonstrates how to adjust LDFs by the relationship between Paid and Incurred using the MunichAdjustment.
# Load data
mcl = cl.load_sample("mcl")

# Traditional Chainladder
cl_traditional = cl.Chainladder().fit(mcl).ultimate_

# Munich Adjustment
dev_munich = cl.MunichAdjustment(paid_to_incurred=("paid", "incurred")).fit_transform(
    mcl
)
cl_munich = cl.Chainladder().fit(dev_munich).ultimate_

plot1_data = cl_munich.to_frame().T.rename(
    {"incurred": "Ultimate Incurred", "paid": "Ultimate Paid"}, axis=1
)

plot2_data = pd.concat(
    (
        (cl_munich["paid"] / cl_munich["incurred"])
        .to_frame(origin_as_datetime=False)
        .rename(columns={"2261": "Munich"}),
        (cl_traditional["paid"] / cl_traditional["incurred"])
        .to_frame(origin_as_datetime=False)
        .rename(columns={"2261": "Traditional"}),
    ),
    axis=1,
)
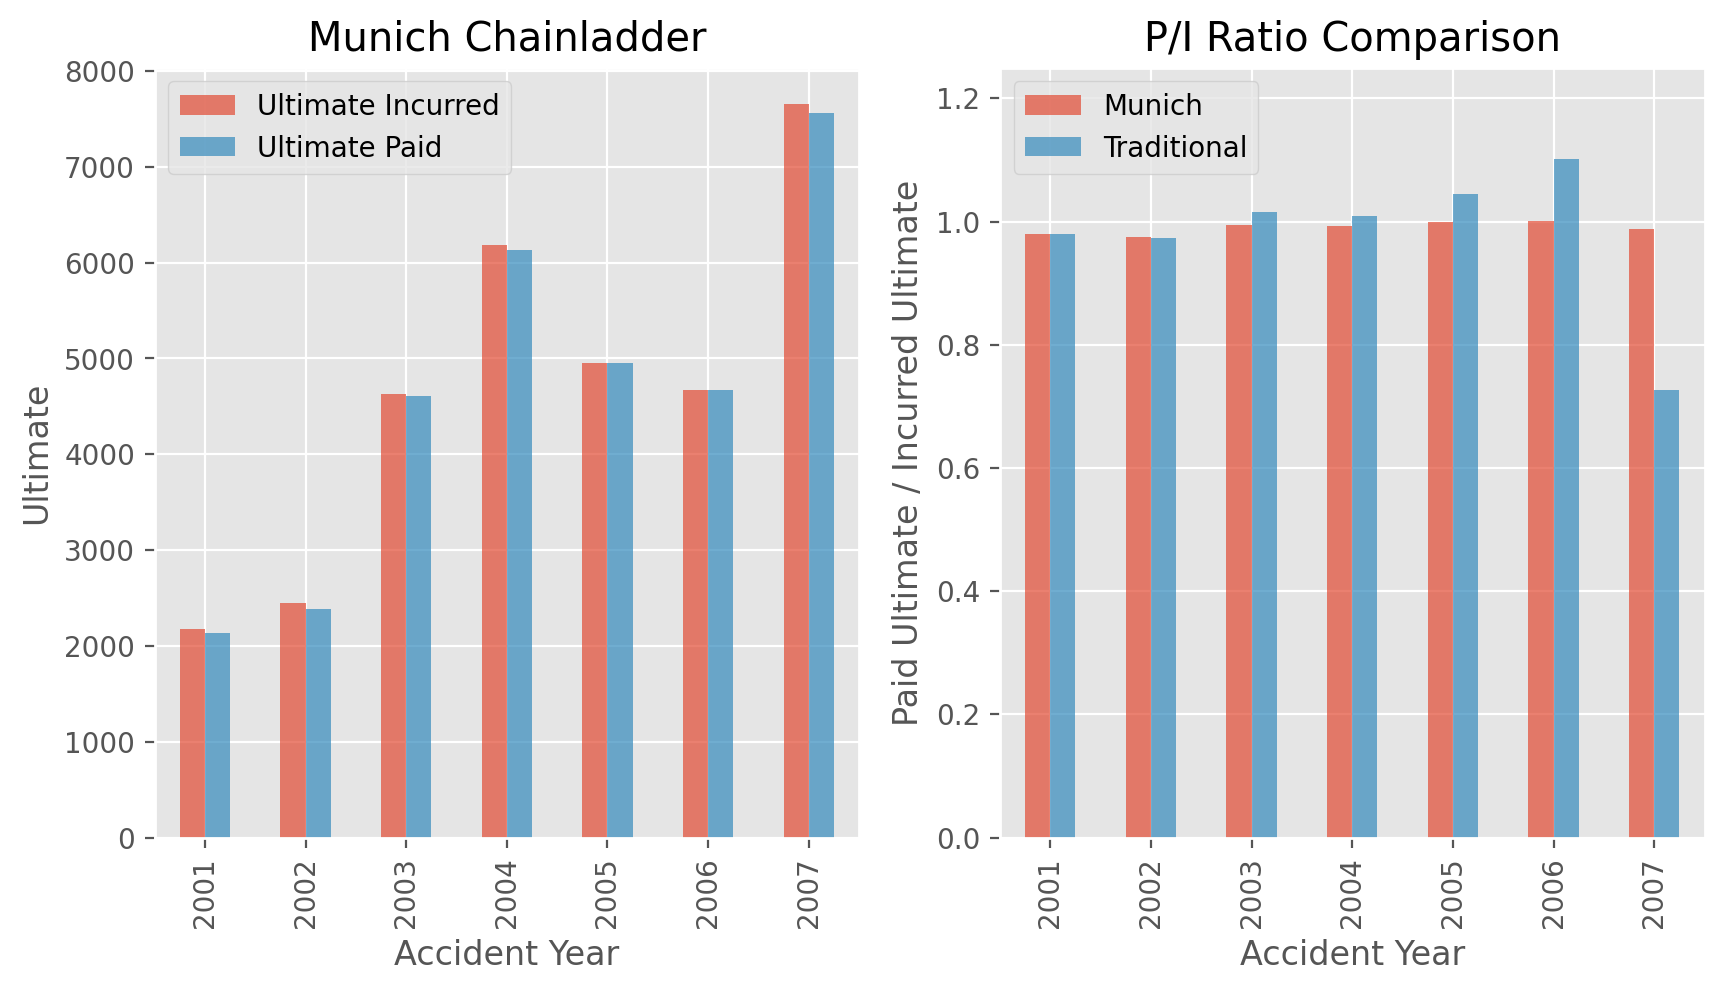
We can see how the Paid / Incurred Ultimates stay close to 1.0 for all origin periods under the MunichAdjustment while they diverge under the traditional Development.