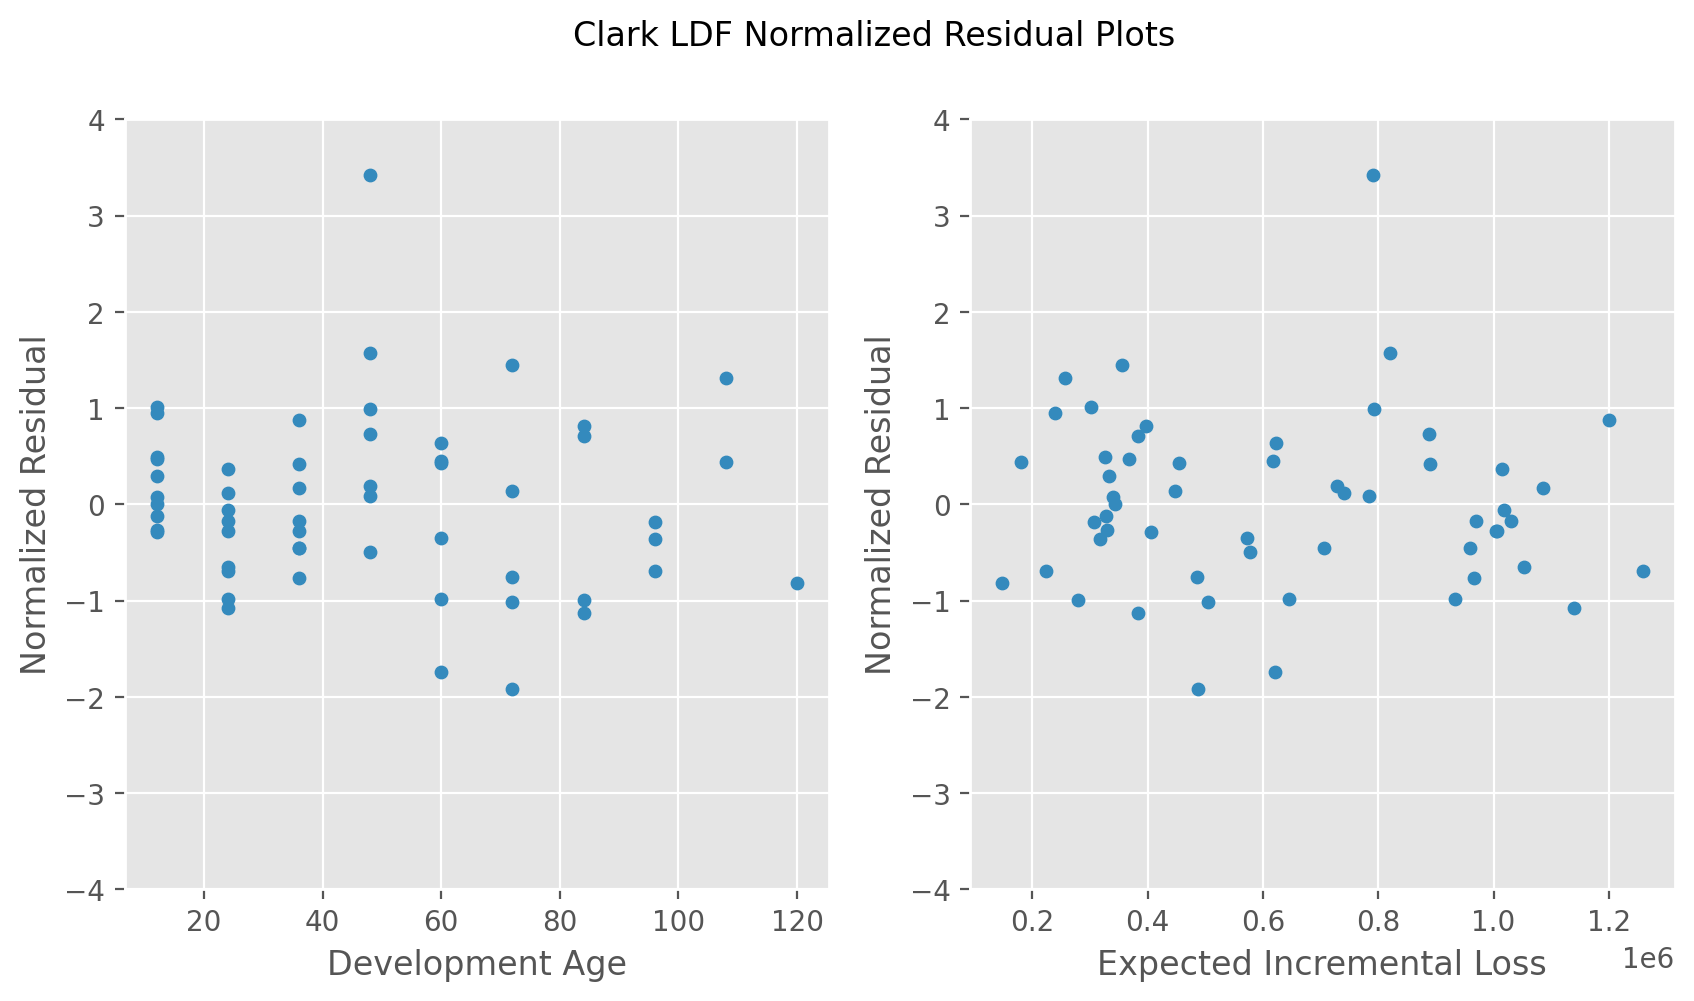
Clark Residual Plots#
import chainladder as cl
This example demonstrates how to recreate the normalized residual plots in Clarks LDF Curve-Fitting paper (2003).
# Fit the basic model
genins = cl.load_sample("genins")
genins = cl.ClarkLDF().fit(genins)

# Grab Normalized Residuals as a DataFrame
norm_resid = genins.norm_resid_.melt(
    var_name="Development Age", value_name="Normalized Residual"
).dropna()

# Grab Fitted Incremental values as a DataFrame
incremental_fits = genins.incremental_fits_.melt(
    var_name="Development Age", value_name="Expected Incremental Loss"
).dropna()
incremental_fits = incremental_fits.merge(
    norm_resid, how="inner", left_index=True, right_index=True
)